
Last updated: August 25, 2026
How This 80/20 Inventory Playbook Improves Technology Warehouses
- The 80/20 rule (Pareto Principle) shows that 20% of SKUs typically drive 80% of annual consumption value, yet many teams fail to translate this into daily warehouse decisions.
- ABC classification combined with a criticality matrix (ABC-VED) ensures high-impact, low-value items receive appropriate control levels to protect service and compliance.
- Slotting, cycle-count frequency and reorder policies should be differentiated by ABC class and criticality tier to reduce picker travel and free working capital.
- Quarterly reviews that integrate forward and reverse logistics data keep classifications accurate as demand, returns and costs shift.
- Premier Logitech helps technology supply chains close the gap between ABC theory and execution. Connect with a lifecycle expert to strengthen an inventory program today.
Core ABC and Reverse Logistics Terms for Technology Warehouses
The following definitions apply throughout this playbook.
- SKU velocity: The rate at which a stock-keeping unit moves through the warehouse, measured in units picked or sold per period.
- Annual consumption value (ACV): Unit cost multiplied by annual units consumed or sold. The primary ranking metric for ABC classification.
- ABC classes: Three tiers, A, B and C, assigned by cumulative ACV thresholds of 80% and 95%.
- Criticality: The operational or compliance impact of a stockout, independent of unit cost. A low-cost component that halts a production line is high criticality.
- Forward logistics: The standard supply chain flow from sourcing through fulfillment to the end customer.
- Reverse logistics: The flow of returned, repaired or end-of-life assets back through the supply chain for triage, refurbishment, redeployment or responsible recycling.
- RMA (Return Merchandise Authorization): The formal process authorizing a customer to return a product for repair, replacement or credit.
- Depot repair: Centralized repair operations, typically tiered from Level 1 (basic diagnostics) to Level 4 (board-level repair), performed at a dedicated facility.
- Asset recovery: The process of extracting residual value from end-of-life or returned technology assets through refurbishment, remarketing, parts harvesting or certified recycling.
U.S. technology supply chains add compliance dimensions, including data security, TAA sourcing requirements, NIST and CMMC frameworks, that influence which items warrant elevated criticality ratings regardless of their ABC class. With these definitions in place, the next step is to build the data foundation for accurate classification.

Step 1: Gather and Cleanse SKU-Level Data for ABC Analysis
ABC analysis depends on accurate, complete data. Required inputs include trailing 12-month unit sales or consumption by SKU, current unit cost for each SKU, open RMA and return volumes by SKU and lead times from primary suppliers.
Before ranking, cleanse the dataset to remove noise that distorts classification. Remove discontinued SKUs and consolidate duplicate part numbers, since both create artificial splits in consumption data. Flag items with fewer than three months of history for separate treatment, because short histories produce unreliable annual projections. For technology asset programs, coordinate with IT asset management, depot repair and procurement teams to reconcile forward and reverse flow data in a single view.
This stage balances completeness and speed. A partial dataset supports an initial classification that guides early decisions. A complete, cleansed dataset supports a classification that holds through the quarterly review cycle with fewer manual overrides.
Learn how Premier Logitech structures data intake for large-scale technology programs.
Step 2: Calculate Annual Consumption Value for Each SKU
Annual consumption value is calculated as annual consumption quantity multiplied by unit cost. In Excel, with SKU identifiers in column A, unit cost in column B and annual units in column C, the formula in column D is:
=B2*C2
After populating column D for all rows, calculate each SKU’s value share in column E:
=D2/SUM($D$2:$D$[last row])
Sort the entire table descending by column D, then calculate cumulative value share in column F:
=SUM($E$2:E2)
Column F provides the cumulative value position for each SKU and becomes the basis for ABC class assignment in Step 3. ABC classification should always rank SKUs by annual usage value, quantity multiplied by unit cost, rather than by unit quantity alone.
Explore integration options for ACV calculations with existing WMS or ERP data exports.
Step 3: Assign ABC Classes Using Cumulative-Value Thresholds
The standard cumulative-value cutoffs are 80% for Class A and 95% for Class B, with Class C covering the remainder. In Excel the class assignment formula in column G is:
=IF(F2<=80%,"A",IF(F2<=95%,"B","C"))
These thresholds serve as starting points rather than fixed rules. Practitioners may tighten Class A to 75% in regulated environments or stretch it to 85% for catalogs with many small accessories that drive basket size. With SKUs ranked by the ACV calculated in Step 2, these cutoffs divide the population into clear A, B and C tiers.
See how threshold calibration works for a specific technology asset catalog.
Step 4: Use a Criticality Matrix to Protect High-Impact C Items
Standard ABC classification ranks items by dollar value and ignores the operational consequence of a stockout. A $4 component can be C value under ABC yet A criticality under risk scoring, which shows why criticality must override pure cost in stocking decisions for high-impact technology assets.
For technology asset and returns programs, the three criticality grades map as follows:
- Vital (V): Stockout causes service interruption, compliance failure or data-security exposure. Examples include serialized replacement units under active warranty SLAs and certified data-destruction media.
- Essential (E): Stockout impairs performance but a workaround exists. Examples include standard configuration accessories and depot repair consumables.
- Desirable (D): Stockout has limited operational impact. Examples include cosmetic packaging components and low-demand peripheral cables.
The 9-cell ABC-VED matrix produces three management tiers. Category I cells, AV, AE and BV, receive tight control with continuous or weekly reorders and real-time digital tracking. Category III cells, CD, BD and AD, receive relaxed oversight with quarterly reorders and manual counts. All remaining cells fall into Category II with moderate controls.

Teams should document items manually promoted from C to tighter control based on criticality, with a clear business justification, and review those decisions at each quarterly refresh. For spare parts and technology assets, standard value-based ABC should be run first, then cheap but mission-critical items should be promoted to tighter control to protect uptime without over-investing in low-impact C items.
Review how a criticality overlay supports technology asset and RMA inventory.
Step 5: Redesign Slotting and Pick Paths by ABC Class
ABC slotting places A items in prime golden-zone locations at waist-to-shoulder height near packing and shipping areas, which reduces picker travel time. The slotting assignment rules by class create a clear physical layout that reflects value and movement.
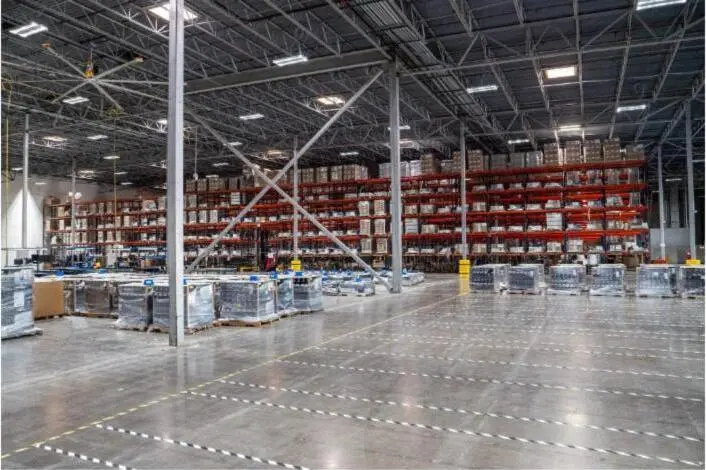
- Class A: Golden zone at waist-to-shoulder height within the first pick aisle closest to pack and ship stations. Ergonomic bin sizes matched to pick unit. Forward pick face replenished from reserve stock.
- Class B: Mid-distance storage on accessible rack levels within secondary aisles. Standard bin sizes. Replenished on a scheduled cycle.
- Class C: Farthest zones on upper rack levels or in consolidated bulk storage. High-density shelving to maximize cube utilization. Replenished in larger, less frequent lots.
For technology asset programs with active returns streams, RMA receiving and triage staging should sit adjacent to Class A forward-pick locations. This placement reduces travel when refurbished units re-enter the forward pick face after depot repair.
The cube-per-order index, item volume divided by pick frequency, refines 80/20 slotting by preventing bulky low-velocity items from occupying premium near-dock locations even when they have moderate pick frequency. Teams should calculate CPOI for each SKU and rank ascending before finalizing zone assignments.
No 2022 study in the Journal of Industrial Engineering and Management attributes 30–40% of unnecessary pick walk time to poor slotting. The journal’s relevant 2024 paper discusses slotting optimization without that statistic.
Explore slotting design approaches for combined forward and reverse logistics operations.
Step 6: Align Cycle Counts and Reorder Rules with ABC Classes
Cycle-count frequency and reorder policy should follow ABC class and criticality tier, not a uniform calendar applied to all SKUs. The table below summarizes recommended policies for technology asset programs.
| Class | Cycle-Count Frequency | Variance Tolerance | Target Fill Rate |
|---|---|---|---|
| A | Weekly to bi-weekly | Zero tolerance, any discrepancy triggers investigation | 98–99% |
| B | Monthly | 1–2 unit variance | 95% |
| C | Quarterly to semi-annually | Up to 3% of on-hand quantity | 90% |
Items with long lead times or high unit costs should be elevated one ABC classification tier for cycle-counting purposes even when revenue places them in a lower tier.
Reorder policies also differ by class. A items use continuous review, reorder point plus order quantity, with frequent forecast updates. C items run on periodic review or simple min-max replenishment. For technology asset programs, Vital-class items in any ABC tier should carry safety stock calculated using a service-level factor of Z = 2.33, which corresponds to a 99% service level.
Blind counting, where the counter does not see the expected quantity, improves first-count accuracy and should apply to all A-item locations and variance recounts.
See how cycle-count policies can be configured within an existing WMS for technology asset programs.
Step 7: Run a Quarterly ABC Review for Forward and Reverse Flows
ABC analysis should be re-run quarterly for stable industries and monthly for fast-moving sectors. Technology supply chains typically sit between these poles, with stable core SKUs, periodic product launches and seasonal RMA spikes.
A practical quarterly review includes the following steps, each building on the previous one:
- Export trailing 12-month consumption data and recalculate ACV for all active SKUs, which refreshes the foundation for classification.
- Re-run the cumulative percentage ranking and reassign ABC classes using the established thresholds, which may shift as ACV changes.
- Review criticality overrides to confirm that promoted C items still warrant elevated control, since operational priorities can change.
- Update slotting assignments for SKUs that have changed class, with focus on A-to-B demotions and C-to-A promotions.
- Adjust cycle-count schedules in the WMS to reflect new class assignments so counting effort stays aligned with value.
- Review RMA and returns data to identify SKUs whose reverse-flow volume warrants reclassification.
- Document changes and communicate them to picking, receiving and depot repair teams to keep execution aligned.
For programs with active returns integration, the quarterly review should include a reconciliation of refurbished units re-entering forward inventory. Units that re-enter at sufficient volume may shift a SKU’s effective velocity and warrant a class promotion.
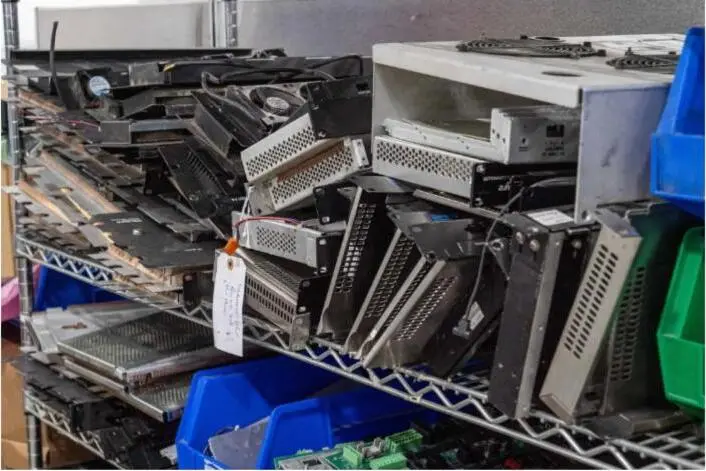
Design a review cadence that connects forward and reverse logistics data.
Common ABC Pitfalls in Technology Supply Chains
Several failure modes recur across technology asset programs that attempt to operationalize ABC analysis.
- Inaccurate consumption data: Returns and RMA units recorded as new receipts inflate ACV for some SKUs and deflate it for others. To prevent this distortion, separate forward and reverse flow data before calculating ACV, then reconcile at the review stage.
- Mismatched criticality assessments: Criticality ratings assigned by procurement differ from those assigned by depot repair or compliance teams, which leads to the mismatches described in Step 4. Conduct a cross-functional criticality review before finalizing the ABC-VED matrix.
- Over-counting C items: Teams that apply uniform count frequencies to all SKUs spend disproportionate labor on low-impact items. Enforce class-specific frequencies in the WMS rather than relying on manual scheduling.
- Returns disruption to forward slotting: High-volume RMA intake can temporarily displace A-item forward pick locations when receiving and triage staging are not physically separated. Designate dedicated returns staging zones adjacent to, but distinct from, forward pick aisles.
- Static classifications: ABC classification must be re-run dynamically as sales and costs update rather than left static, because demand shifts cause classes to drift and counting effort to be applied to lines that no longer carry the most value or movement.
KPIs That Show ABC Inventory Control Is Working
Leading indicators signal whether the program executes correctly before lagging metrics confirm results.
Leading indicators to track weekly include:
- Cycle-count completion rate by ABC class, with a target of 100% for A items
- Variance rate per 1,000 picks segmented by class
- Slotting compliance, measured as the percentage of A items confirmed in golden-zone locations
Lagging indicators to track monthly include:
- Picker travel distance per order compared to the pre-slotting baseline
- Order fill rate by ABC class against service-level targets
- Days of supply by class, with A items carrying tighter coverage than C items
- Dollar-weighted inventory accuracy rate, since top-quartile warehouses achieve high accuracy
For technology asset programs, add asset recovery yield, the percentage of returned units successfully refurbished and redeployed, as a program-specific lagging indicator tied to reverse logistics throughput.

Frequently Asked Questions
How often should ABC classifications be reclassified for a technology asset program?
Most technology asset programs benefit from a quarterly reclassification cycle. Programs with frequent product launches, seasonal RMA spikes or significant customer mix changes should reclassify monthly. The trigger for an off-cycle reclassification is any material change in SKU velocity, unit cost or returns volume that would shift more than 5% of SKUs across class boundaries.
What skills or tools are needed to run ABC analysis at scale?
A basic ABC analysis requires only a spreadsheet with 12 months of consumption data and unit costs. At scale, programs with thousands of active SKUs and active returns streams, a WMS or ERP with ABC classification and cycle-count scheduling modules reduces manual effort and enforces class-specific policies automatically. Cross-functional coordination between procurement, depot repair and compliance teams is as important as the tooling.
How does reverse logistics data factor into ABC classification for technology programs?
Returned units that re-enter forward inventory after depot repair contribute to a SKU’s effective annual consumption volume. If refurbished units are not reconciled with new-unit consumption data before ACV is calculated, the classification will understate velocity for high-return SKUs. RMA intake volume should also inform criticality ratings, since SKUs with high return rates and long repair lead times carry elevated stockout risk and may warrant promotion to a higher control tier.
What compliance considerations affect ABC policy design for U.S. government or enterprise programs?
Programs subject to NIST, CMMC or TAA requirements must account for data-security obligations when designing cycle-count and asset-recovery policies. Serialized assets requiring certified data destruction before disposition should be classified as Vital regardless of ABC class, which ensures they receive the tightest tracking and handling controls. Compliance reporting requirements may also mandate count frequencies and variance documentation that exceed standard ABC minimums for certain asset categories.
When does it make sense to engage an external lifecycle partner rather than managing ABC optimization internally?
Internal teams are well positioned to run ABC classification and set policies. Execution gaps typically emerge at the intersection of forward and reverse logistics, when RMA volume, depot repair throughput and forward inventory replenishment must be coordinated across multiple facilities or OEM authorization requirements. An external lifecycle partner with authorized service center status, certified compliance frameworks and integrated WMS visibility can close those gaps without requiring internal teams to build and staff those capabilities from scratch.
Putting the 80/20 Rule to Work in Technology Warehouses
Applying the 80/20 rule to warehouse inventory follows a repeatable sequence: cleanse SKU data, calculate annual consumption value, assign ABC classes at the 80% and 95% cumulative thresholds, overlay a criticality matrix, redesign slotting, set differentiated cycle-count frequencies and reorder rules, then review quarterly. Each step strengthens the one before it.
For technology asset programs the process extends into reverse logistics, since RMA integration, depot repair throughput and asset recovery yield operate as part of the same inventory system. Premier Logitech has delivered end-to-end lifecycle and reverse logistics services since 2007, supporting OEMs, enterprises and government agencies with secure, compliant and scalable operations across the full technology lifecycle.
