
Last updated: August 27, 2026
Key Takeaways for Tech Distribution Layouts
- Standard ABC slotting and straight-line flow designs miss electronics fragility, security zoning and the mix of inbound, outbound and returns traffic.
- A seven-step, simulation-backed framework addresses electronics constraints in facilities from 100,000 to 1 million square feet and cuts travel time and missed carrier cutoffs.
- SKU profiling must include handling attributes such as weight, size, hazard class, temperature needs, lot and serial control and packaging fragility to set forward-pick locations.
- Velocity-plus-affinity slotting with security overlays and congestion-aware distribution prevents dark cells and balances zone workload in high-SKU environments.
- Premier Logitech provides lifecycle services and layout validation expertise that improve warehouse performance, from slotting rules to simulation-backed redesigns.
Step 1: Capture SKU and Order Profile Data
High-velocity tech distribution centers rely on 12 to 24 months of demand history, including seasonality and promotions, to profile SKUs before layout redesign. This anchors decisions in actual flows instead of assumptions.
Required data inputs include velocity, cube, weight, stackability, fragility rating, declared value, hazard class, unit-of-measure conversions, vendor pack quantities, serial and lot requirements and returns rate by SKU. These inputs must be segmented by channel such as ecommerce, wholesale and retail because each channel drives different slotting and pick paths.
SKU profiling must include handling attributes such as weight, size, hazard class, temperature needs, lot and serial control and packaging fragility. These attributes often override pure velocity when setting forward-pick locations. Declared value for high-value electronics also drives security zoning decisions that velocity analysis alone does not capture.
Coordination spans operations, IT for WMS and ERP extraction, procurement for vendor pack and ASN data and finance for value thresholds that define secure-zone classification. Once SKU and order profiles are captured and aligned, the next step is to map how inventory moves through the facility.
Step 2: Map a Clean Material-Flow Spine for Tech SKUs
Modern warehouses map four macro flows separately to prevent congestion in high-velocity operations. These flows cover inbound from receiving through staging, quality checks and put-away, internal replenishment from reserve to forward pick, outbound from picking through packing and loading and exceptions such as returns, damages and cycle counts.
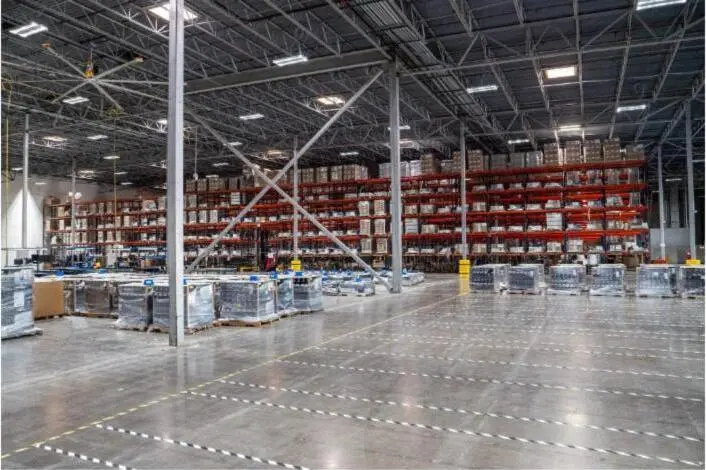
A spine-and-rib flow architecture places a central accumulation conveyor or travel lane as the primary spine with perpendicular pick aisles branching from it. This structure supports separate zone picking for productivity while still integrating inbound inventory movement, replenishment and returns into the shared material-flow spine.
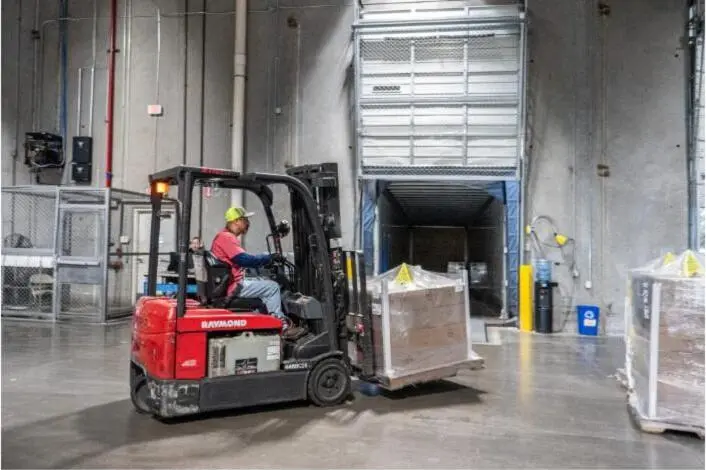
Facilities benefit from separate inbound and outbound dock doors when traffic volumes justify the investment. Staging lanes should be sized to 1.25 to 2.0 times peak door turns to prevent dock congestion. Returns need a dedicated path with distinct diagnosis, quarantine, grading, rework and reintegration flows instead of a simple reverse of inbound lanes.
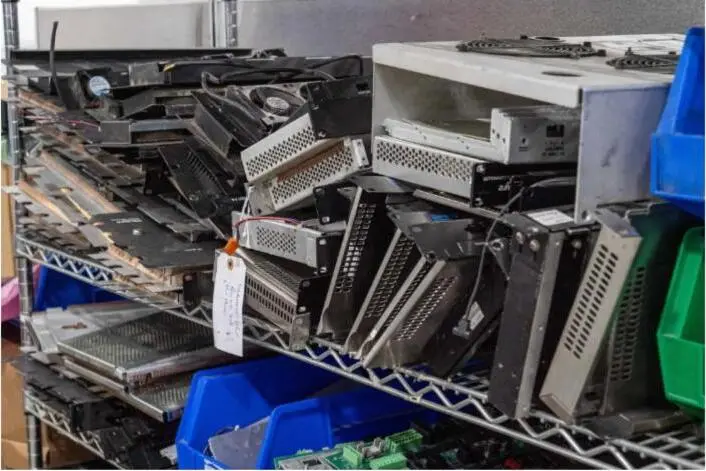
Through-flow layouts suit high-volume linear operations but require dock doors on opposite walls. U-flow layouts share dock resources and suit buildings with dock access on one side. The building envelope sets this choice before other design factors.
Step 3: Apply Velocity-Plus-Affinity Slotting Rules
Velocity-based slotting reduces average pick path distance by placing the fastest SKUs in the most accessible forward-pick locations. Electronics operations extend this baseline with affinity and security overlays.
Order affinity analysis identifies items that ship together frequently so they can be co-located and shorten pick paths. Clustering smartphones with compatible cases and chargers reduces multi-stop travel on high-line-count orders.
A warehouse slotting strategy should treat safety, compatibility, equipment fit and physical constraints as hard pass-or-fail conditions before travel, replenishment, congestion and space. High-value electronics often require cage storage or access-controlled zones regardless of velocity rank. These constraints override affinity clustering when objectives conflict.
Velocity-only ABC slotting often creates dark cells in a single aisle, which forces pickers to queue even when travel distance on paper looks lower. Congestion-aware slotting distributes A-items across multiple aisles to balance workload and reduce aisle conflicts.
Step 4: Design Forward-Pick and Reserve Storage Architecture
Forward-pick faces for fast movers should hold two to five days of demand and receive quarterly review. Monthly review suits fast-growth catalogs that experience frequent velocity shifts.
Forward-pick face allocation uses cube-per-order index or hits-per-slot metrics to rank candidates. Par levels then align with pick frequency and replenishment economics so prime locations avoid constant replenishment or chronic underuse.
Electronics layouts must align ergonomics with fragility rules. Items above a defined weight threshold need team-lift designation or mechanical assist, which affects aisle width and pick-face height. Fragile units should not occupy top-shelf positions where drop risk increases. Slotting places A-items near primary pick paths at ergonomic golden zones between mid-thigh and shoulder height.
Reserve storage feeds forward pick through dedicated replenishment lanes scheduled in off-peak windows. Replenishment moves use dedicated lanes, time-boxed low-pick windows, one-way aisle rules or end-of-aisle staging to avoid interference with active picking.
Assess forward-pick architecture for complex electronics SKU profiles with support from Premier Logitech.
Step 5: Create a Multi-Mode Picking Table for Tech Orders
Order profiles in large tech distribution centers range from single-unit ecommerce orders to multi-line enterprise kits and full-pallet B2B shipments. Each profile needs a different pick method because a single mode across all orders creates throughput bottlenecks.
For pure ecommerce picking of small units with high order frequency and short travel paths, a realistic benchmark is 80 to 120 units per hour for mixed operations. Well-tuned high-velocity zones can exceed 150 units per hour. Case and pallet pulls for B2B operations support lower units-per-hour benchmarks.
A multi-mode picking table maps each order profile to its best method. Discrete picking suits single-line ecommerce orders. Batch or cluster picking fits multi-line consumer orders. Zone-route picking supports high-SKU kit assembly. Zone-route architecture allows one worker per zone in normal periods, with the option to add workers during peaks or have one worker cover multiple zones during low volume.
Wave timing must align with zone capacity to prevent congestion. When labor schedules release waves without regard to zone limits, multiple pickers crowd the same aisle during peak hours and create bottlenecks. Staggered wave release by zone prevents aisle saturation without new automation.
Step 6: Align Packing and Shipping Layout with Carrier Cutoffs
Pack station placement relative to pick zones directly affects carrier cutoff performance. Pack stations located far from high-velocity pick zones add travel time that compounds across thousands of orders each day.
Order cutoff times, promised ship times and the choice between batching or on-demand release shape put-away logic, pick paths and fast-mover proximity to pack-out. Pack station count and placement should match P95 outbound volume instead of average daily volume.
Dimensional weight rules for electronics require pack stations to stock a range of carton sizes. Oversized cartons on small-unit orders inflate freight cost. Undersized cartons on fragile electronics increase damage claims. Station layout should place carton size selection within arm’s reach of the packing surface to reduce motion.
Shipping staging lanes must absorb carrier pickup variability. Many sortation systems are designed around average volumes rather than peak demand. Seasonal spikes, promotions and shifting order patterns can push a system beyond its limits when variability is not addressed in the design.
Step 7: Run P95 Peak-Demand Simulation and Maintain Slotting
Warehouse layout validation should use P50, P90 and P95 percentiles instead of averages alone. Stress tests at P90 and P95 demand levels, plus 30 percent volume spikes, equipment failures and staff absences, reveal tail-risk congestion and service degradation.
Warehouse simulation projects start with a digital twin of the current layout and operation. The model is calibrated until it reproduces historical KPIs within a 5 to 10 percent tolerance. Only then do teams test future scenarios.
A strong stress-testing protocol includes events such as a 50 percent Black Friday or Cyber Monday peak, sudden arrival of high-volume SKUs from a new client and temporary loss of material-handling equipment. These scenarios confirm that the proposed layout holds up under realistic disruptions.
After implementation, slotting rules need ongoing maintenance. ABC and XYZ velocity-based rules should be revisited quarterly because promotions, new product introductions and vendor pack changes shift ideal placements in high-SKU environments. KPI dashboards that track leading and lagging indicators help sustain gains from the redesign.
Validate a proposed layout against P95 peak demand with simulation support from Premier Logitech before committing to physical changes.
KPI Dashboard for Layout Performance
Leading indicators signal layout problems before they appear in financial results. Operations teams can track travel time per pick, replenishment frequency by zone, queue length at pack stations and percent adherence to slotting rules. Layout performance also benefits from metrics such as space utilization rate, slotting density, pick rate, order cycle time, throughput volume and dock-to-stock time, with comparisons by zone, shift and workload period.
Lagging indicators confirm whether the redesign delivers business value. Key lagging metrics include order cycle time, asset recovery value from returns, compliance findings per audit period, total landed cost per unit and first-pass yield on returns triage. Clear separation between leading and lagging metrics allows operations teams to intervene before lagging metrics decline.
Common Challenges and Mitigations in Tech Layout Projects
Three recurring challenges often undermine layout redesign projects in large tech distribution centers.
Inaccurate SKU master data drives slotting decisions based on wrong dimensions, weights or velocity classifications. The symptom appears as replenishment frequency mismatches and forward-pick faces that either run out or overflow. Fragmented item master ownership across procurement, IT and operations often sits at the root. A data governance checkpoint before slotting analysis, with cross-functional signoff on cube, weight and handling attributes, mitigates this risk.
Unclear ownership of returns triage turns the returns area into a holding zone instead of a processing function. High-SKU environments with volatile launches and integrated returns need dedicated returns processing with defined service levels for each disposition path, as outlined in the returns flow design in Step 2. Assigning a focused returns team with clear SLAs for each path resolves this issue.
Peak-hour congestion at pack-out occurs when wave release timing floods pack stations at once. Simulation-led redesigns can cut order turnaround time and reduce pick-pass bottlenecks. Staggered wave release and pack station buffer sizing, validated in simulation before rollout, address this congestion directly.
Measuring Success of a Tech Warehouse Redesign
Leading metrics measure process adherence and early warning signals. Useful leading indicators include percent of SKUs slotted within defined velocity class, average replenishment travel distance, zone utilization balance across shifts and wave-to-cutoff completion rate.
Lagging metrics measure business outcomes. Core lagging indicators include total landed cost per unit shipped, first-pass yield on returns processing, asset recovery value per returned unit and compliance findings per audit cycle. A facility that tightens slotting, adjusts batch logic and improves wave timing at the same time can achieve meaningful pick rate gains within 90 days without new technology.
This distinction matters because lagging metrics move slowly. A layout change that improves slotting adherence and reduces replenishment travel will shift leading metrics within weeks. The same change may take a full quarter to appear in cost-per-unit figures, so teams that track only lagging metrics lose the chance to course-correct early.
Build a KPI framework for a facility’s layout redesign with guidance from Premier Logitech’s warehousing team.
Frequently Asked Questions
What makes warehouse layout optimization different for tech distribution versus general merchandise?
Tech distribution introduces constraints that general merchandise layouts rarely face at the same scale. High-value electronics need access-controlled or caged storage zones that override standard velocity-based slotting. Fragility rules affect pick-face height assignments and aisle equipment selection. Returns volumes in tech run higher than in most categories, and returned units carry data security obligations that require quarantine and certified disposition paths. Volatile product launches create sudden SKU velocity shifts that static ABC slotting cannot absorb without manual intervention. A layout designed for tech distribution treats security zoning, fragility and returns integration as primary design constraints.
How does Premier Logitech support warehouse and asset management for large tech operations?
Premier Logitech provides warehousing and asset management services that include inventory reporting, device traceability, asset tagging and tracking and lifecycle services that span receiving, exchange, staging, returns and retirement. Asset recovery with secure data wipe also forms part of the service set. The company operates as both a single-source lifecycle partner and a modular services provider, so clients can engage for end-to-end program management or select services such as configuration and fulfillment, kitting or transportation on a standalone basis. Facilities in the Dallas-Fort Worth area and nearshore operations in Laredo support national distribution programs for OEMs, telecom providers and government agencies.
When should a tech distribution center run P95 peak simulation instead of relying on historical averages?
P95 simulation is warranted whenever a facility faces conditions that historical averages cannot represent. Examples include a major product launch, a new client program that changes order mix, a planned facility expansion or a layout redesign that affects dock, pick and pack capacity at the same time. Averages mask tail-risk scenarios when inbound volume, outbound demand and returns all peak together and drive service failures and expedited freight spend. Running simulation at P95 demand levels before physical changes identifies bottlenecks that appear only under stress and allows layout adjustments before capital is committed.
How often should slotting rules be reviewed in a high-SKU electronics distribution center?
Quarterly review works for most high-SKU electronics operations. Monthly review suits fast-growth catalogs or facilities that manage frequent product launches. Promotions, new product introductions and vendor pack changes all shift ideal slot placements. A slotting review should compare current velocity data with assignments from the last review, flag SKUs that moved between velocity classes and identify forward-pick faces that consistently run out or stay overstocked. Facilities with dynamic slotting capabilities in their WMS can automate parts of this process, while human review still validates security-zone assignments and fragility classifications.
What compliance requirements affect warehouse layout design for government and enterprise tech programs?
Government and enterprise tech programs often require layouts that support TAA-compliant product handling, secure data destruction for returned assets and audit-ready chain-of-custody documentation from receiving through disposition. Frameworks such as NIST, CMMC and SOC 2 set requirements for physical access controls, data handling procedures and reporting that influence zone design, access-controlled storage placement and returns processing flows. Premier Logitech holds certifications across these frameworks and designs warehousing and asset management operations to support client compliance obligations, including secure data wipe and compliance reporting as part of the returns and recovery process.
