Key Takeaways
- Reverse logistics programs often receive limited funding because costs sit in scattered budgets and benefits lack a clear ROI model.
- A defensible ROI calculation uses the formula (Total Recovered Value + Cost Avoidance − Total Program Cost) ÷ Total Program Cost × 100 and separates recovered revenue from cost avoidance for CFO review.
- Hidden costs such as transportation, labor, inspection, refurbishment, software, 3PL fees, storage and disposal must be mapped and reconciled before any ROI model becomes reliable.
- Key performance indicators such as cost per return, recovery rate, return-to-stock rate, days to disposition and avoided write-offs feed the ROI model and should be tracked continuously.
- Premier Logitech provides ASC-authorized repair, L1–L4 depot capabilities and compliance infrastructure that increase recovery value and reduce program cost. Start a reverse logistics business case with a lifecycle expert.
Prerequisites And Context For Modeling Reverse Logistics Program ROI
This guide serves Directors of Reverse Logistics, VPs of Supply Chain, VPs of Global Operations, Directors of Logistics and Directors of Product Lifecycle. The intended reader builds a business case for a reverse logistics program, a software purchase or a 3PL or partner engagement.
Several terms recur throughout the model. Definitions follow.
- Reverse logistics program ROI: Net program benefit divided by total program cost, expressed as a percentage.
- Reverse logistics cost per return: All-in cost to process a single return across every cost category.
- RMA: Return merchandise authorization. The intake record that initiates a return.
- Depot repair: Centralized, facility-based repair, typically categorized by level (L1–L4) based on repair depth.
- ITAD: IT asset disposition. The structured process of recovering, sanitizing and disposing of end-of-life IT assets.
- Return-to-stock rate: The percentage of returned units restored to sellable inventory without repair.
- Days to disposition: Elapsed time from return receipt to final disposition decision.
- Avoided write-offs: Asset value preserved through repair or refurbishment rather than disposal.
- Payback period: Time required for cumulative net program benefits to recover total program investment.
- Cost avoidance vs. recovered revenue: Cost avoidance is spending that does not occur because the program exists. Recovered revenue is cash received from resale, refurbishment or liquidation.
Reverse logistics program ROI is difficult to model in U.S. technology supply chains for three structural reasons. Costs sit in multiple functional budgets, so no single owner sees the total. Benefits are asserted rather than measured, which makes them easy to challenge. Payback is rarely modeled, so the liquidity question remains unanswered. This guide focuses on high-value, serialized, warranty-driven electronics and IT asset returns, where recovery value and compliance risk differ from generic retail returns.
Scope a reverse logistics program with a lifecycle expert before building the model.
The Reverse Logistics Program ROI Formula: Costs And Benefits That Matter
Reverse logistics program ROI measures the net financial return of a structured returns program relative to its total cost. It is calculated as net program benefit, defined as total recovered value plus cost avoidance minus total program cost, divided by total program cost and expressed as a percentage. This formula gives CFOs a single, auditable number to evaluate program investment.
The formula stated explicitly:
Reverse Logistics Program ROI = (Total Recovered Value + Cost Avoidance − Total Program Cost) ÷ Total Program Cost × 100
Total program costs include every line item that the program incurs. Named cost categories are:
- Transportation and reverse freight
- Labor (intake, inspection, grading, repair, repackaging)
- Inspection and grading
- Refurbishment and depot repair
- Software and systems (RMA platforms, WMS, analytics)
- 3PL or partner fees
- Storage and warehousing during processing
- Disposal and recycling
- Program overhead (management, compliance, reporting)
Total benefits include every financial gain the program generates. Named benefit categories are:
- Resale and refurbishment revenue
- Liquidation revenue
- Avoided write-offs (assets recovered rather than disposed)
- Reduced replacement spend (repaired units redeployed instead of new purchases)
- Carrying-cost reduction (faster disposition reduces inventory holding cost)
- Operational cost avoidance (consolidated vendor relationships, reduced freight spend)
Recovered revenue and cost avoidance belong in the same model and should appear as separate line items. CFOs treat cash received from resale differently from spending that did not occur. Clear labeling preserves the program’s economics during budget review.
Design a cost and benefit taxonomy for a specific program with a lifecycle expert.
Why Reverse Logistics Is Difficult To Cost And How That Affects Risk
Reverse logistics programs often remain underfunded because their true cost stays invisible. Transportation, labor, inspection, refurbishment, software, 3PL fees, storage and disposal costs each sit in a different functional budget. Because no single owner sees the full picture, the program appears cheaper than it is until a CFO asks for a consolidated number.
Transportation alone can account for up to 60% of total reverse logistics spend, making it the single largest cost layer. Reverse freight often sits inside a logistics budget that also covers forward shipments, which makes isolation difficult without a dedicated cost center or freight audit.
Hidden costs distort reverse logistics program ROI in two directions. Programs look more expensive when costs are finally surfaced. Programs also appear riskier when costs remain hidden and benefits go unmeasured. These effects combine to reduce investment.
Practical steps for surfacing hidden costs include:
- Map cost ownership across operations, IT, procurement and finance before building the model.
- Trace cost per return through each disposition path: return-to-stock, refurbish and resell, liquidate, harvest parts and recycle.
- Reconcile program costs against general ledger categories to confirm every line item is captured.
Three friction points drive the hidden-cost problem in practice. Inconsistent returns data prevents calculation of a reliable cost per return. Unclear ownership leaves no single function accountable for total program cost. Non-standard disposition rules across sites produce different cost outcomes for identical units, which makes benchmarking unreliable. The worked example below shows how a structured model addresses these friction points step by step.
Worked Example Structure For High-Volume Reverse Logistics ROI
The following six-step structure applies to high-volume, serialized electronics and IT asset returns programs. Each step identifies the inputs, outputs and decisions that change the result.
- Define program scope and annual return volume. Inputs include product categories, return channels, geographic scope and annual unit volume. The output is a bounded program definition that determines which costs and benefits belong in the model. A key decision is whether to model a single product line or a consolidated enterprise program.
- Establish baseline reverse logistics cost per return across all cost categories. Inputs include freight invoices, labor hours by function, 3PL contracts, software licenses, storage rates and disposal fees. The output is a fully loaded cost per return by disposition path. Industry benchmarks for consumer electronics place all-in processing costs at $35–$55 per return, inclusive of functional testing and open-box depreciation. Serialized IT assets with warranty and compliance requirements reflect program-specific costs. APQC benchmarking frameworks provide a structured approach to categorizing and comparing cost per return across operations.
- Estimate recovery value by disposition path. Inputs include resale prices by condition grade, liquidation rates, parts harvest values and recycling credits. The output is a recovery value per unit by path. Mature ITAD programs can recover up to 40% of original value on reconditioned laptops and workstations, with revenue reinvested to offset new IT refresh cycles. Value recovery rates vary significantly by electronics category rather than falling within a single broad range: well-maintained business-class laptops (3–4 years old) typically retain 15–30% of original purchase price, while categories such as school Chromebooks and small monitors recover far less, often yielding only $30–$100 per unit or less than their processing cost.
- Quantify cost avoidance. Inputs include avoided write-off values, replacement unit costs, carrying cost rates and vendor consolidation savings. The output is a cost avoidance total that supplements recovered revenue in the benefit calculation. A key decision concerns which avoidance items have documentation support and which rely on assumptions that require disclosure.
- Sum total benefits and total program costs, then calculate net benefit and ROI. Apply the formula (Total Recovered Value + Cost Avoidance − Total Program Cost) ÷ Total Program Cost × 100. Present recovered revenue and cost avoidance as separate line items within total benefits.
- Model payback period and phase investment over 3–5 years. The section below outlines the method and typical phasing pattern.
For a hypothetical enterprise IT asset returns program that processes serialized devices at scale, this structure produces a traceable and auditable output at each step. Actual numbers reflect program data, while the structure makes the result defensible.
Validate cost and recovery assumptions for a specific program with a lifecycle expert.
Payback Period And Investment Phasing For Reverse Logistics Programs
Payback period often remains absent from reverse logistics business cases because program benefits are asserted rather than measured. Without a benefit timeline, finance teams lack a basis for calculating when cumulative net benefits recover the initial investment. CFOs rely on payback period because it answers the liquidity question and shows how long capital remains at risk.
Payback period equals initial investment divided by annual net cash inflow for uniform cash flows. Reverse logistics programs typically have uneven annual benefits because year one involves stabilization costs. For these programs, build a cumulative cash-flow schedule and interpolate within the recovery period: Payback = Full periods before recovery + (Unrecovered cost ÷ Cash inflow in recovery period).
Net present value (NPV) complements payback by discounting each period’s net cash flow at the organization’s weighted average cost of capital. NPV produces a dollar measure of value added rather than a time measure. Both metrics belong in a CFO-ready business case.
A 3–5 year phased model structure for reverse logistics programs typically follows this pattern:
- Year one — investment and stabilization: Highest capital outlay. Process design, system integration, partner onboarding and staff training. Benefits remain partial as the program ramps. The payback clock starts here.
- Year two — process optimization: Cost per return declines as throughput increases and disposition rules stabilize. Recovery rates improve as grading consistency improves. Net benefit grows.
- Years three to five — scale and margin improvement: Full program throughput. Vendor consolidation savings materialize. Advanced analytics improve disposition decisions. ROI and NPV reach modeled targets.
Phasing reduces upfront capital risk and shortens effective payback by spreading investment across periods when benefits also grow. A staged-investment approach phases capital expenditure over multiple years rather than making a lump-sum investment, which reduces fixed overhead risk and aligns outflows with benefit realization.
Present three scenarios, labeled conservative, base and upside, to give the CFO a range rather than a single point estimate. The conservative case uses the lowest defensible recovery rates and highest cost assumptions. The upside case reflects full program maturity. The base case represents the most likely outcome given current program data.
The KPIs That Anchor Reverse Logistics Program ROI
Each KPI below maps directly to a line in the ROI model. Tracking these metrics creates a feedback loop that updates the model as actual results replace assumptions.
- Reverse logistics cost per return maps to total program cost. It is calculated as total annual reverse logistics spend divided by total returns processed. A methodology for normalizing this metric divides total annual reverse logistics spend by total retail value of goods returned, which produces a cost-per-dollar-of-merchandise-value figure for cross-category comparison.
- Recovery rate maps to recovered value. It reflects the percentage of returned asset value recovered through resale, refurbishment or parts harvest.
- Return-to-stock rate maps to recovered value and carrying-cost reduction. Higher return-to-stock rates reduce refurbishment cost and accelerate revenue recovery.
- Days to disposition maps to carrying cost and customer experience. A returned unit worth 70% of retail value can drop to 40% or less within weeks if left unprocessed. Faster disposition directly protects recovery value.
- Avoided write-offs map to cost avoidance. This metric is tracked as the difference between disposal value and recovered value for units that would otherwise have been written off.
- Return-reason reduction maps to reduced return volume and program cost. Declining return rates on specific SKUs indicate upstream product or fulfillment improvements that lower total program cost.
Leading indicators such as process adherence, queue times and inspection throughput signal future ROI performance before lagging indicators confirm it. Lagging indicators such as total cost, recovery value and customer satisfaction validate the model against actual results. Standard reporting, periodic reviews, exception monitoring and operational dashboards provide sufficient tracking infrastructure for most programs at scale.
The 5 R’s Of Reverse Logistics As Recovery-Value Levers
In an ROI model, the 5 R’s, defined as returns, resale, repair, refurbishment and recycling, work best as levers that move recovery value or program cost.
- Returns: The intake process sets data quality for every downstream decision. Accurate condition grading at intake increases return-to-stock rate and reduces misrouted units. Faster intake shortens days to disposition and lowers carrying cost.
- Resale: Direct resale of return-to-stock units recovers the highest margin. Restock as new represents 25–40% of returns with 100% margin recovery in typical disposition funnels. Maximizing this path acts as the fastest payback lever.
- Repair: Depot repair converts units that would otherwise be liquidated or disposed into resalable inventory. Sixty-eight percent of consumer electronics returns are classified as No Fault Found, which means most returned units hold recoverable value if processed correctly. Repair economics depend on labor cost, parts availability and authorized service center status.
- Refurbishment: Cosmetic and functional refurbishment moves units from B-stock to sellable condition. Certified refurbished programs can recover 50–70% of retail value for consumer electronics. A proprietary refurbished channel recovers more margin than B2B liquidation.
- Recycling: Recycling serves as the lowest-recovery disposition path and fits units where repair and refurbishment costs exceed recoverable value. Responsible recycling with documented chain of custody satisfies compliance requirements and manages regulatory exposure.
In the ROI model, resale and repair levers deliver the fastest payback. Refurbishment extends recovery to a broader unit population. Recycling closes the loop on units with no remaining asset value while managing compliance cost.
Build Vs. Outsource: How Partner Economics Shape Reverse Logistics ROI
Build versus outsource decisions change total program cost, recovery value and payback period at the same time.
Building an in-house reverse logistics operation requires capital investment in facility space, equipment, staffing, training and systems. In-house repair operations face a structural problem because return volume is lumpy, quiet one month and backlogged the next, which makes cost-effective staffing for peaks difficult. Fixed overhead during low-volume periods increases cost per return and extends payback.
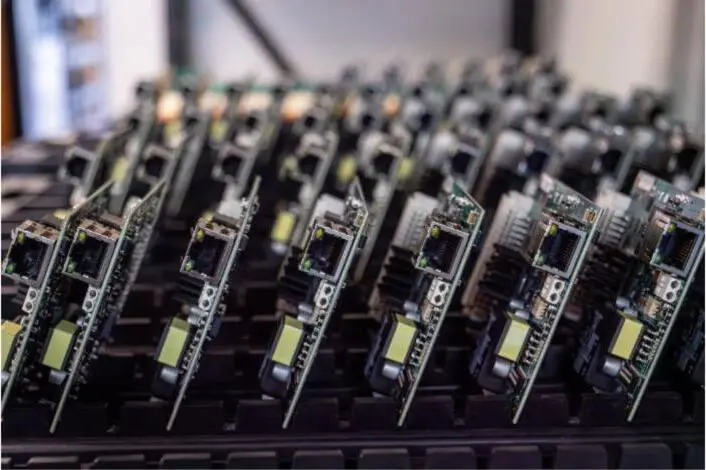
Outsourcing to a specialized partner converts fixed costs to variable costs that scale with return volume. Specialized reverse logistics 3PLs can lower per-unit processing costs through volume, specialization and access to secondary market relationships. The outsource ROI case includes partner fees and also captures access to authorized repair networks, established liquidation channels and compliance infrastructure that would require significant investment to build internally.
Partner selection criteria that directly affect ROI include:
- ASC authorization for OEM brands in the program’s product mix. Authorized repair preserves warranties and supports the highest-value recovery path.
- Depot repair capability across L1–L4 levels. Deeper repair capability increases the percentage of units recovered rather than liquidated.
- Vendor consolidation. Replacing fragmented repair, fulfillment and recycling providers with a single partner removes coordination gaps, double-shipping costs and competing SLAs.
- Compliance infrastructure. TAA, NIST, CMMC, SOC 2 and ISO 9001/14001 certifications reduce compliance cost and risk for government and enterprise programs.
Premier Logitech operates as an ASC-authorized service center for more than 20 OEM brands. Its teams provide L1–L4 depot repair, rapid exchange programs, secure data destruction and compliance reporting across TAA, NIST, CMMC, SOC 2 and ISO 9001/14001 frameworks. The operation runs three DFW facilities with nearshore operations in Mexico and a network of premier LTL carriers across North America. These facilities process more than 40,000 repairs per week and support kitting capacity of 500,000 units per month. Single-vendor consolidation through Premier Logitech replaces fragmented repair, fulfillment and recycling providers with one accountable partner and one set of SLAs.
The ROI model should evaluate each potential partner against the specific cost categories and recovery paths that matter most for the program in question.
Review build versus outsource economics for a specific program with a lifecycle expert.
Common Challenges And Troubleshooting In Reverse Logistics ROI Modeling
Several recurring challenges appear in reverse logistics ROI modeling. Each challenge includes how it surfaces in operations metrics, likely root causes and practical mitigation options.
- Inaccurate returns data: This issue surfaces as wide variance in cost per return across periods. Root causes include inconsistent RMA intake processes, missing serial number capture and non-standard condition grading. Mitigation involves standardizing intake procedures and grading rubrics across all sites before building the model.
- Unclear cost ownership: This issue surfaces as cost per return that changes when different functions contribute data. Root causes include distributed budgets and no single program owner. Mitigation involves mapping cost ownership to a single accountable function before the model is built, then reconciling against the general ledger.
- Inconsistent disposition rules across sites: This issue surfaces as different recovery rates for identical units processed at different locations. Root causes include site-level discretion in grading and disposition decisions. Mitigation involves implementing a documented, four-grade disposition rubric, defined as sellable, refurbishable, parts-only and dispose, applied consistently across all sites.
- Missed recovery-value assumptions: This issue surfaces as actual recovery value that falls below modeled projections. Root causes include optimistic resale price assumptions and failure to account for value erosion during extended days-to-disposition cycles. Mitigation involves using conservative recovery rates in the base case and modeling value erosion as a function of days to disposition.
- Non-compliant disposition: This issue surfaces as regulatory exposure, failed audits or customer contract violations. Root causes include inadequate data destruction documentation and unverified downstream recycling. Mitigation involves requiring serialized Certificates of Data Destruction and documented chain of custody for every unit, aligned with NIST 800-88 Rev. 1 standards.
Advanced Practices For Reverse Logistics Program ROI Improvement
Organizations that stabilize the foundational model can pursue advanced practices that improve ROI further. Readiness criteria for each practice appear below.
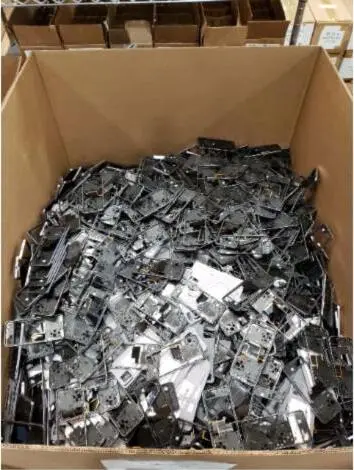
- Automation in returns processing: Automated sortation and machine-vision grading reduce labor cost per return and improve grading consistency. Readiness criteria include sufficient return volume to justify capital investment and stable process design to automate against.
- Advanced analytics for disposition decisions: AI-driven disposition routing matches units to the highest-yield recovery channel in real time. AI-driven disposition routing recovers 10–30% more value per returned unit than rule-based manual systems. Readiness criteria include clean, consistent returns data and a defined disposition hierarchy.
- Dynamic routing: Real-time carrier and lane selection for reverse freight reduces transportation cost per return. Readiness criteria include TMS integration and sufficient volume to support carrier agreements.
- Integration across partners: API-level integration between RMA platforms, WMS, depot repair systems and financial reporting removes manual reconciliation and improves data quality. Readiness criteria include stable partner relationships and defined data standards.
- Circular economy models: Parts harvesting, remanufacturing and certified refurbished sales channels extend asset value beyond the primary recovery cycle. Readiness criteria include OEM authorization for refurbished channel participation and established secondary market relationships.
Pilot advanced practices through proof-of-concepts before full deployment. A/B process tests that run the advanced practice on a subset of return volume alongside the baseline process produce measurable ROI data before full-scale investment.
Explore advanced reverse logistics program design and ROI improvements with a lifecycle expert.
Frequently Asked Questions
What Are The Returns Involved In Reverse Logistics?
Reverse logistics encompasses all backward product flows, including customer-initiated returns, warranty claims, end-of-life device recovery, B2B distributor returns, product recalls and manufacturing defect returns. For high-value, serialized electronics and IT assets, warranty-driven returns and end-of-life recovery represent the highest-volume and highest-value categories. Each return type carries distinct cost structures, compliance requirements and recovery-value profiles, so the ROI model should segment returns by type rather than treat all returns as equivalent.
What Are The 5 R’s Of Reverse Logistics And How Do They Drive Recovery Value?
The 5 R’s, defined as returns, resale, repair, refurbishment and recycling, represent the disposition paths available for returned units. In an ROI model, they function as levers that move recovery value and program cost. The body section on the 5 R’s explains how each lever affects margin, payback and compliance.
Why Is Reverse Logistics Difficult To Cost?
Reverse logistics costs sit in several functional budgets, as the earlier section on hidden costs explains. That section also outlines practical steps for surfacing total cost and assigning ownership.
How Do Organizations Calculate Reverse Logistics ROI?
Organizations apply the ROI formula introduced earlier and populate it with program-specific costs and benefits. The detailed formula section covers cost categories, benefit categories and reporting of recovered revenue and cost avoidance as separate line items.
What Is A Typical Payback Period For A Reverse Logistics Program?
Payback period depends on program scope, investment level and recovery rate. The payback and phasing section describes a typical three-stage pattern across years one through five and explains how to model simple and discounted payback.
What Is A Reasonable Reverse Logistics Cost Per Return?
Cost per return varies by product category, disposition path and program maturity. For consumer electronics, all-in processing costs including functional testing and open-box depreciation sit above costs for standard ecommerce goods. The most useful benchmark is cost per dollar of merchandise value returned, which normalizes for category and volume differences. Programs should establish a baseline cost per return across all cost categories before benchmarking against industry ranges, since repair depth, compliance requirements and geographic scope drive significant variation.
How Do Organizations Model Build Vs. Outsource Reverse Logistics ROI?
Organizations compare the fully loaded cost and benefit profile of in-house operations against specialized partners across a 3–5 year horizon. The build versus outsource section details how fixed and variable costs, recovery value and payback period shift under each option.
How Do U.S. Regulations And Industry Standards Shape Reverse Logistics Program Design?
U.S. regulations and industry standards affect reverse logistics program design in three areas: data security, environmental compliance and government contracting. NIST 800-88 Rev. 1 governs data sanitization for IT assets. CMMC applies to all DoD contract and subcontract awardees that process, store or transmit FCI or CUI, while SOC 2 applies to service organizations serving enterprise customers. In the United States, responsible recycling and disposal are governed by the EPA under the Resource Conservation and Recovery Act (RCRA), which regulates household, industrial and manufacturing solid and hazardous wastes; ISO 14001 is a voluntary international standard, not a regulation. TAA compliance is required for GSA Multiple Award Schedule contracts regardless of order size and for federal acquisitions at or above the applicable trade agreement threshold (currently $183,000 for many WTO GPA supply contracts); below those thresholds, the Buy American Act applies instead. Programs that meet these standards reduce regulatory exposure, avoid contract disqualification and protect reputation. Compliance infrastructure should appear as a modeled program cost.
When Should Organizations Revisit Their Reverse Logistics Process Design Or Partner Mix?
Organizations should revisit process design or partner mix when cost per return increases without a corresponding increase in recovery value, when days to disposition extend beyond program targets, when return volume grows beyond current processing capacity, when new product categories with different compliance or repair requirements enter the program or when a partner misses SLA commitments consistently. Quarterly updates to the ROI model as actual results replace assumptions build institutional knowledge and support better program decisions over time.
